Working with Multiple Datasets in dataviewR
dataviewR allows you to explore two or more
datasets in the same session, making it easy to compare
structures, values, and attributes across data sources.
This capability is especially useful when reviewing:
- raw vs
derived datasets
- ADaM vs SDTM datasets
- training vs test sets
- simulation outputs vs expected results
This article walks through how to launch and work with multiple datasets.
1. Launching dataviewR with multiple datasets
You can pass any number of datasets to dataviewer():
library(dataviewR)

dataviewer(iris, mtcars)
Each dataset will appear in its own tab inside the application in the RStudio Viewer pane or the default web browser.
You can pass more than two datasets as well:
dataviewer(iris, mtcars, ToothGrowth, airquality)2. Navigating between dataset tabs
Inside the Viewer pane:
- Each dataset is presented under its own labeled tab
- Switching between tabs does not reset filters or selections
- Each dataset behaves independently (filtering, column selection, metadata)
This makes it easy to compare side-by-side:
- variable names
- attributes (labels and classes)
- missing data patterns
- derived vs raw values
3. Applying filters and selections independently
Each dataset tab maintains:
- its own filter expression
- its own column selection
- its own generated code
- its own metadata panel
This allows you to:
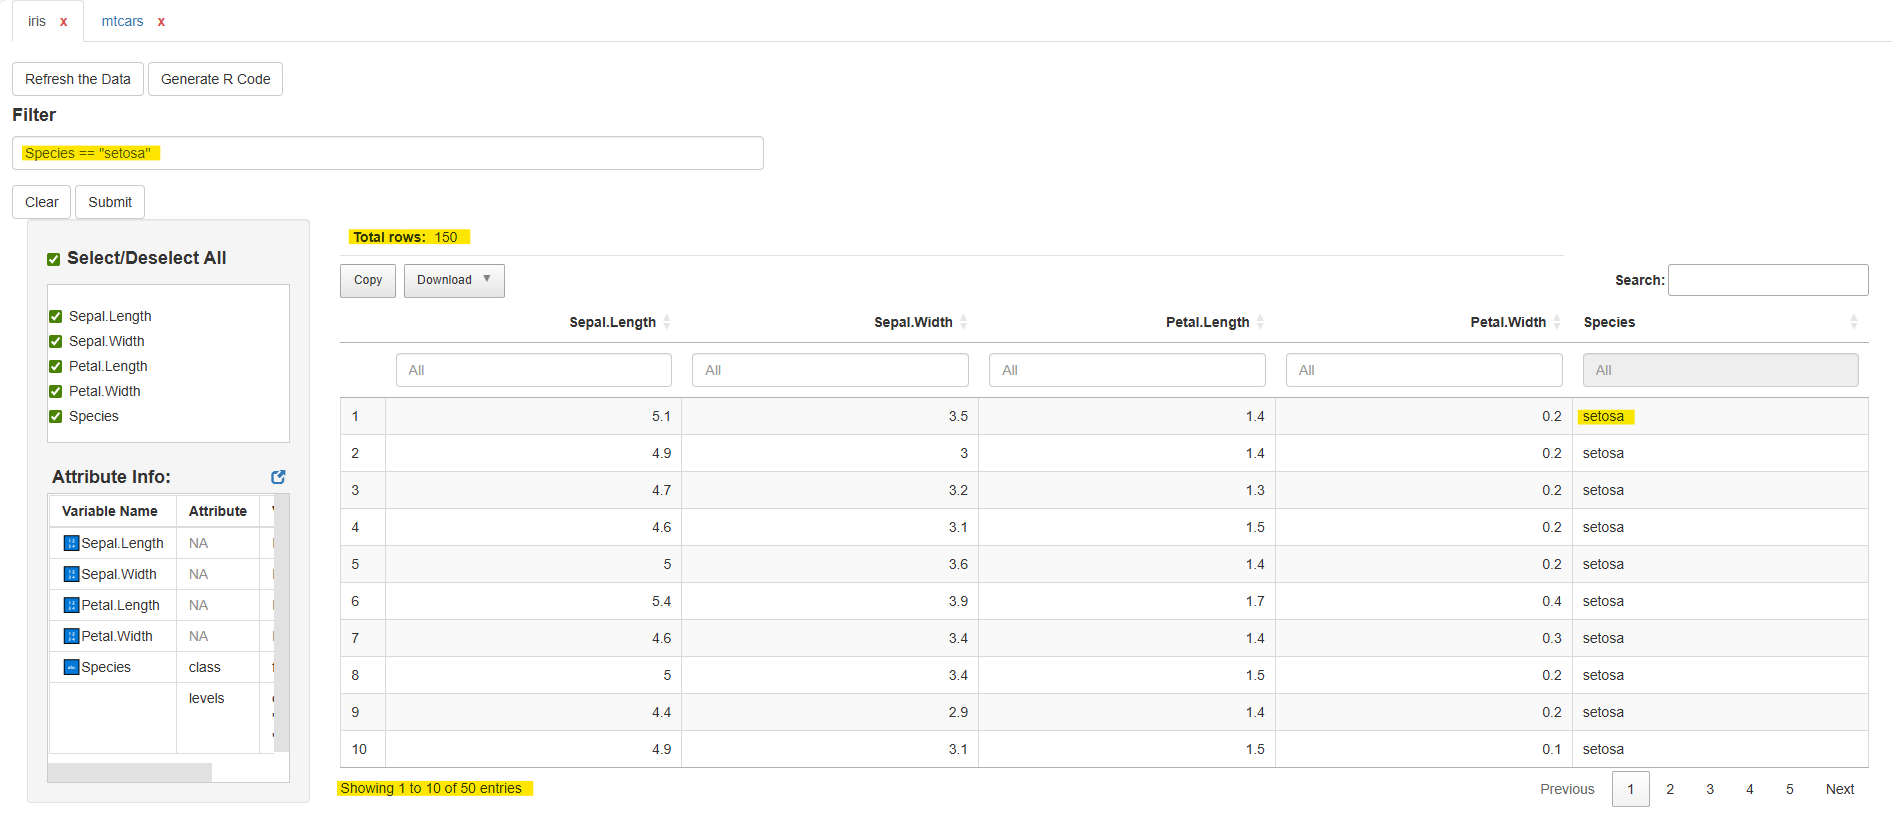
- filter iris on species
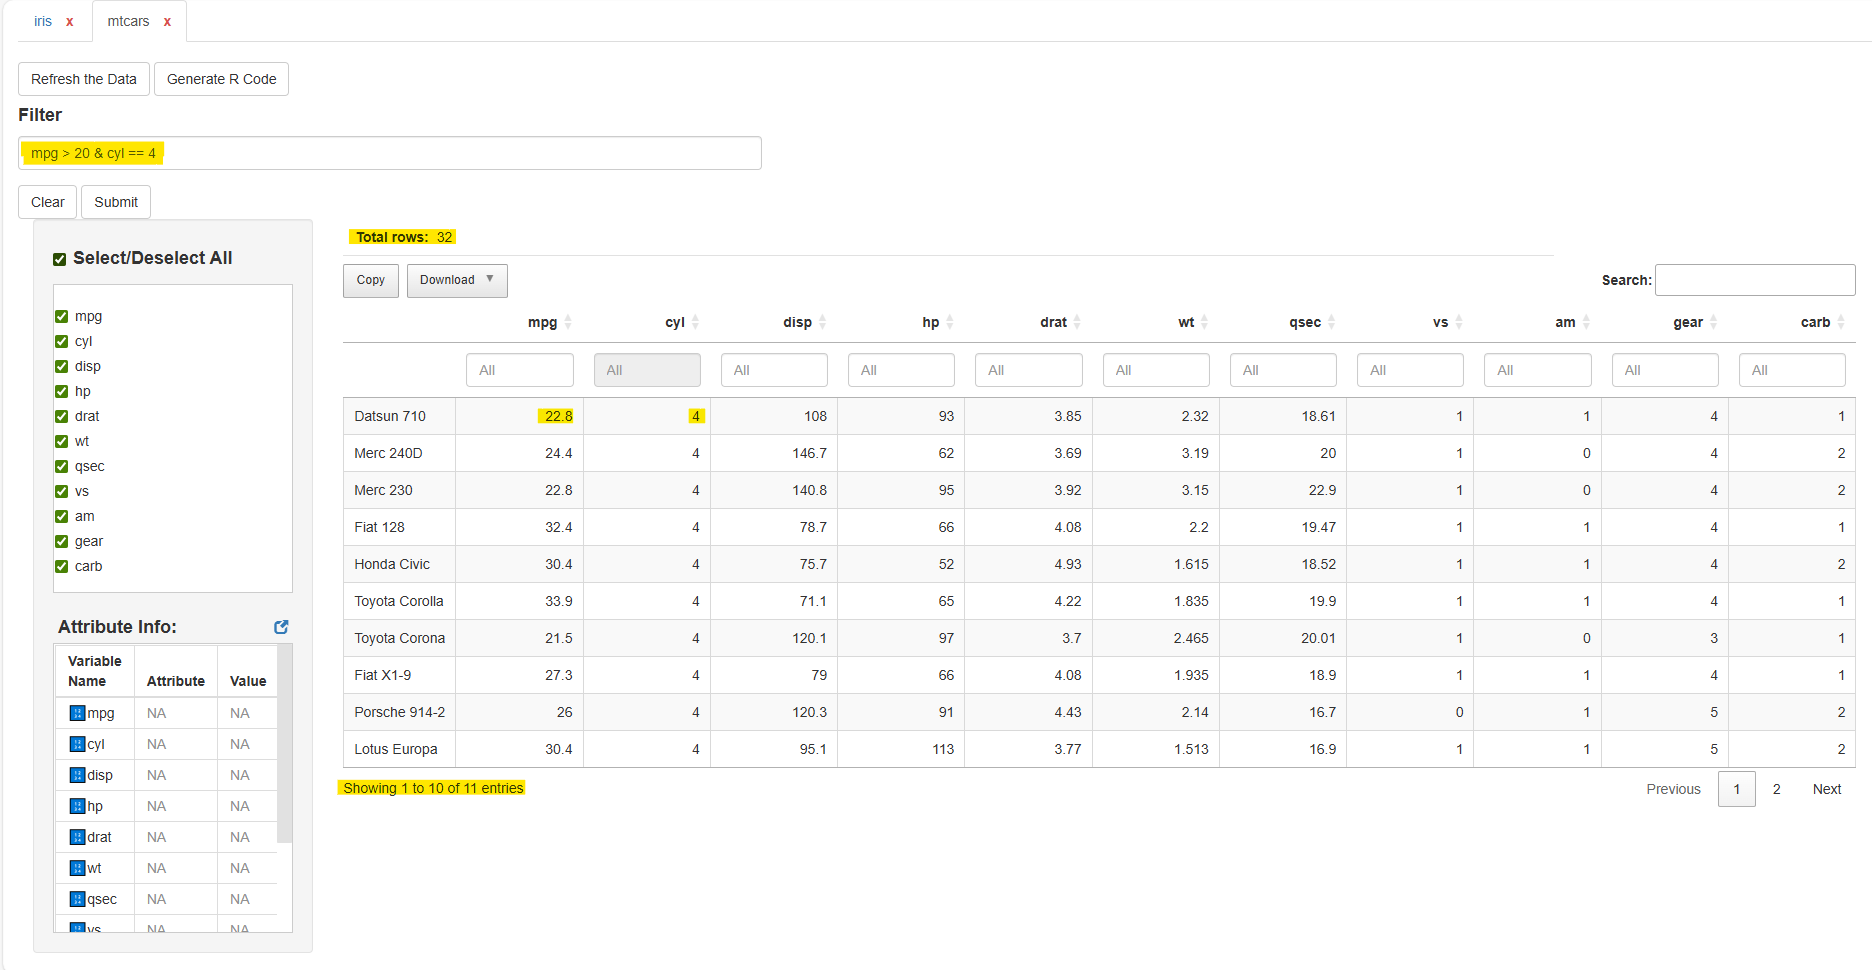
- filter mtcars on horsepower
- compare the results
Example:
Tab: iris
Tab: mtcars
mpg > 20 & cyl == 4
Each dataset’s output, table, and code are kept separate.
4. Independent code generation
Click Generate R Code within any dataset tab to get a reproducible pipeline for that dataset.
Example structure:
# Generated R Code
library(dplyr)

iris |>
  filter(Species == "setosa") |>
  select(Sepal.Length, Sepal.Width, Species)
Switch tabs → generate code for the other dataset.
5. Typical use cases
✓ Raw vs Derived Data
Load both raw and derived datasets:
The dm_raw, dm, and adsl datasets are loaded from the
pharmaverseraw, pharmaversesdtm, and
pharmaverseadam packages, respectively.
library(pharmaverseraw)
library(pharmaversesdtm)
library(pharmaverseadam)

dataviewer(dm_raw, dm)
dataviewer(dm, adsl)
Then:
- Compare variable labels and other attributes
- Confirm derived variables
- Check row/column mismatches
✓ SDTM Dataset Review
library(pharmaversesdtm)

dataviewer(dm, suppdm, ae, suppae)
✓ ADaM Dataset Review
library(pharmaverseadam)

dataviewer(adsl, adae, adlb)
Navigate through tabs to review structure and metadata.
✓ Comparing train/test sets
dataviewer(train_set, test_set)Inspect variable distributions and missingness.
✓ Reviewing multiple simulation outputs
dataviewer(sim1, sim2, sim3)Check how different simulation runs behave.
Summary
In this article, you learned how to:
- Launch dataviewR with multiple datasets
- Navigate dataset tabs
- Filter and select columns independently
- Generate code for each dataset
- Parallel viewing of datasets in each tab
Viewing datasets side-by-side is one of the most powerful features of dataviewR, especially for data review and quality control workflows.
Next Article
Continue with: Working with Clinical Datasets